ETHUSDT
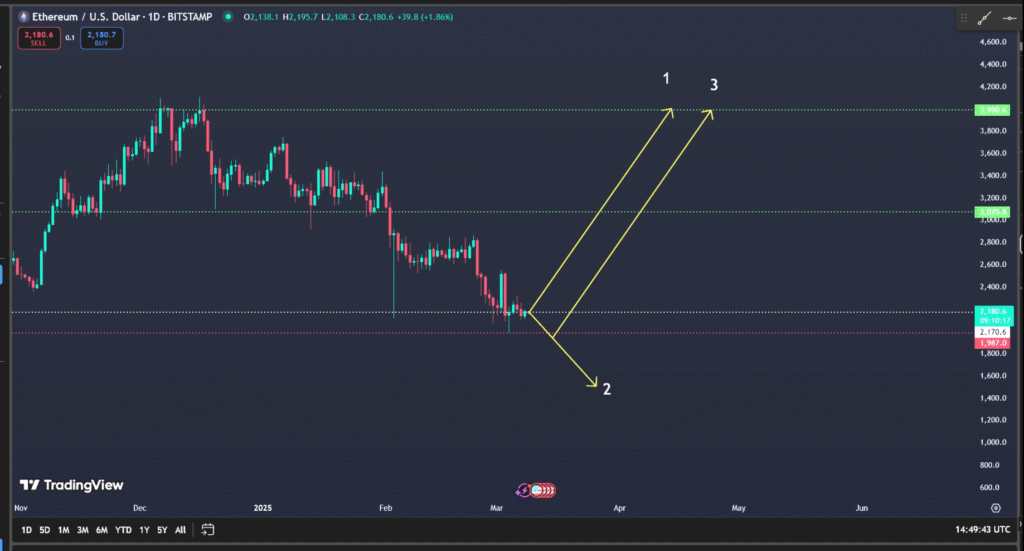
The chart above presents a daily view of Ethereum against the US dollar from late 2024 into early 2025. The market has recently experienced a downward correction but now appears to be forming a potential reversal zone. The yellow trend projections illustrate two possible bullish recovery paths labeled as points 1 and 3, while point 2 represents a potential bearish continuation if the support fails. This analysis reviews the current technical setup, key levels, and forward-looking scenarios for Ethereum in the short to medium term.
Current Market Context
Ethereum has been under pressure over the past few months following a series of macroeconomic and crypto sector corrections. After peaking near the 4000 level in late 2024, the price entered a sustained downtrend, forming lower highs and lower lows. The market found temporary support around the 2000 zone where demand appears to be re-emerging. This level coincides with a key psychological price region and aligns with previous consolidation zones from mid-2023.
The broader crypto market has been influenced by several macro factors including fluctuating US interest rate expectations, the performance of Bitcoin, and evolving regulatory sentiment around digital assets. Ethereum specifically continues to be supported by network upgrades and growth in decentralized finance activity, though investor confidence remains cautious as volatility persists.
Support and Resistance Levels
The chart identifies three significant horizontal levels that define Ethereum’s near-term structure. The first resistance lies around 3075 dollars which has previously acted as a midpoint of market equilibrium during earlier rallies. The second major resistance zone is around 3990 dollars which marks the upper boundary of the projected bullish path. This level represents the key challenge Ethereum must overcome to confirm a full reversal and resume its long-term upward trend.
On the downside, support is found near the 1987 to 2000 range. This level has been tested multiple times and so far has provided a solid foundation for buyers. A decisive break below this region could trigger a deeper pullback toward 1800 or even 1600 depending on broader market sentiment.
Scenario 1 – Bullish Recovery
The first and most optimistic scenario (marked as path 1) envisions a sharp rebound from the current support area. In this case Ethereum would likely retest the 3075 resistance in the near term, followed by a continuation toward 3990 if momentum strengthens. A breakout above this upper level could open the way toward the 4200 to 4400 range, potentially re-establishing a mid-term uptrend.
Several factors support this bullish case. First, the oversold technical conditions have historically preceded strong recoveries in Ethereum’s price. Second, Bitcoin dominance has been stabilizing, which often precedes capital rotation into major altcoins like Ethereum. Finally, increasing network usage metrics, including active addresses and transaction volume, hint at underlying demand that could sustain a rebound.
For traders and investors this scenario suggests accumulating positions near current support with targets at 3075 and 3990 while maintaining risk controls below the 1900 level. A confirmed breakout above 4000 would strengthen the bullish case further and signal renewed institutional interest.
Scenario 2 – Bearish Continuation
The second path (labeled as 2) depicts a bearish outcome in which Ethereum fails to hold its current support zone and resumes its downtrend. In this event selling pressure could accelerate, pushing the price below 2000 and possibly toward the next demand area near 1700. This scenario could be triggered by renewed macroeconomic uncertainty, tightening liquidity conditions, or negative sentiment in the broader crypto market.
A break below 1900 would invalidate most short-term bullish setups and indicate that Ethereum remains in a longer corrective phase. Traders should be cautious in such a situation and focus on defensive strategies or wait for new confirmation signals before re-entering the market.
Scenario 3 – Gradual Recovery with Consolidation
The third projection (path 3) represents a more moderate trajectory where Ethereum rebounds gradually rather than explosively. In this pattern the market would move upward in stages, first toward 3075 before encountering resistance and consolidating. A sustained period of sideways accumulation between 3000 and 3500 could provide a healthy base for a more sustainable long-term recovery later in the year.
This scenario is supported by the current lack of extreme volatility and moderate volume levels which suggest cautious but steady accumulation by market participants. It aligns with Ethereum’s historical behavior of stabilizing before major breakouts rather than reversing sharply.
Technical Indicators and Sentiment
Although not visible in the chart snapshot, typical supporting indicators such as the Relative Strength Index and moving averages likely show mixed signals at this stage. The RSI is expected to be near neutral after recovering from oversold levels, while the 50-day moving average remains below the 200-day average confirming a longer-term bearish bias. However, if the price continues upward for several sessions, a crossover could form a positive technical catalyst.
Market sentiment across crypto remains cautiously optimistic. The focus on blockchain scalability, layer 2 solutions, and staking yield continues to support Ethereum’s long-term narrative even if short-term volatility persists.
Conclusion
Ethereum stands at a crucial junction with clearly defined technical boundaries. The 2000 zone acts as a decisive pivot point between potential recovery and continued decline. The bullish paths suggest targets around 3075 and 3990 while a break below 1900 would reintroduce bearish momentum. Traders and investors should monitor these key levels closely as they represent the battleground between accumulation and distribution forces in the current market structure.
In summary Ethereum’s chart implies a balanced outlook where both recovery and further weakness remain possible. Strategic patience and disciplined risk management are essential as the market approaches a decision point that could define its direction for the first half of 2025.
