The Balance Between Win Rate and Risk/Reward Ratio: Why Staying Near the Equilibrium Line Matters
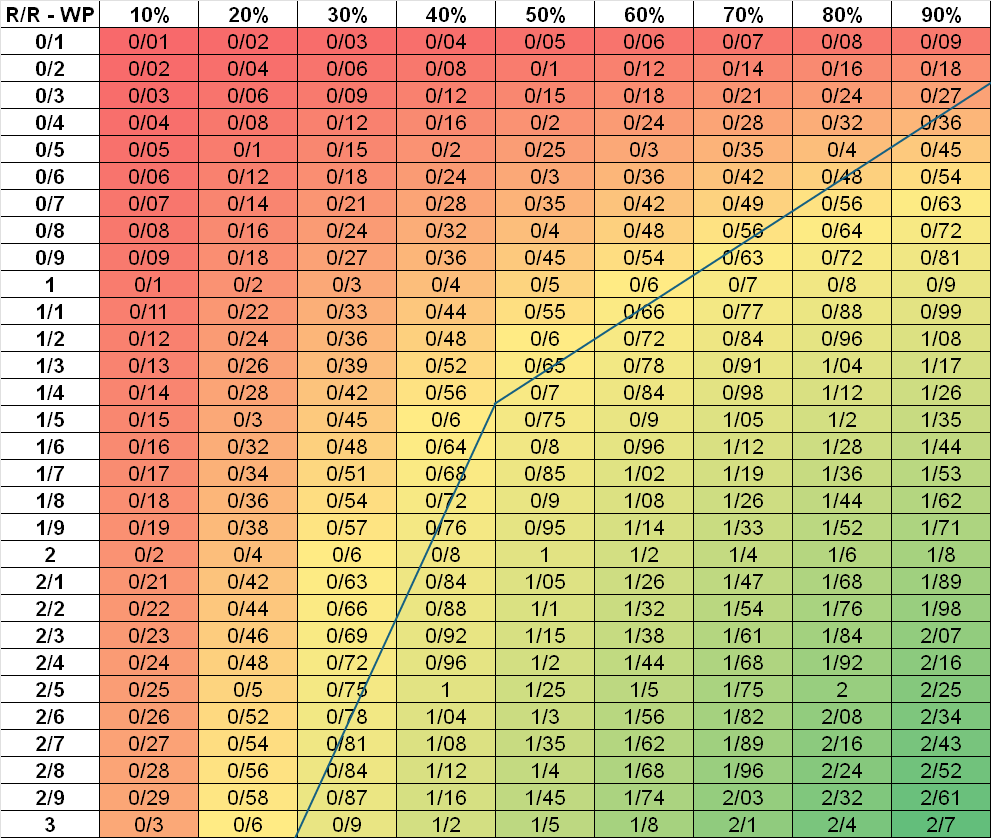
In trading, success is rarely about finding a “perfect” strategy with flawless predictions or infinite profits. Instead, it’s about achieving balance — a sustainable equilibrium between how often you win (Win Rate) and how much you make when you win versus how much you lose when you lose (Risk/Reward Ratio). The image above, often called a profitability matrix, captures this delicate balance beautifully. Each cell represents a combination of Win Rate (WP – winning percentage) and Risk/Reward Ratio (R/R). The curved line cutting through the chart marks the boundary between profitability and loss. Traders whose performance lies above this line tend to grow their accounts consistently, while those below it slowly lose money over time.
The goal, therefore, is not necessarily to maximize Win Rate or to chase extremely high Reward/Risk ratios, but rather to operate close to that line — the point of harmony where risk, reward, and probability interact in a stable, sustainable way.
1. Understanding the Core Relationship
The basic formula linking Win Rate (W) and Risk/Reward Ratio (R) is quite simple:
Expected Value (EV)=(W×R)−(1−W)\text{Expected Value (EV)} = (W \times R) – (1 – W)Expected Value (EV)=(W×R)−(1−W)
In words, this means: your profitability depends on how much you win on average per trade multiplied by how often you win, minus the losses you incur when you don’t.
The equilibrium line shown in the chart marks where the Expected Value (EV) = 0 — the break-even point. Any trader whose results fall exactly on this line neither gains nor loses money over time. Above the line, EV is positive; below it, EV is negative.
That line is crucial because it visually represents mathematical balance. It shows how much reward you need to justify a given win rate, or conversely, how high your win rate needs to be to compensate for a given reward-to-risk ratio. This is why staying near it — not too far above or below — keeps your system realistic and grounded in probability.
2. The Illusion of Extremes
One of the biggest misconceptions in trading is the belief that a high win rate automatically equals a successful strategy. Many traders, especially beginners, prefer systems that “win often,” thinking that frequent victories will lead to emotional satisfaction and financial growth. However, the matrix exposes a hidden truth: a high win rate often comes at the cost of poor risk/reward balance.
For instance, a trader who wins 90% of the time but risks $10 to make $1 (R/R = 0.1) will eventually blow up their account after a few losing streaks. Conversely, a trader who wins only 30% of the time but aims for 3:1 reward-to-risk ratios may be equally unprofitable if their losses occur too frequently or their execution is inconsistent. Both extremes — excessively high win rate or excessively high R/R — are inherently unstable.
This is why being close to the equilibrium line matters. It’s not about perfection but about sustainability. Near the line, your system balances psychological comfort and statistical robustness. You win often enough to stay motivated, and your winning trades are large enough to cover the inevitable losses.
3. The Psychology of Balance
Beyond math, trading is an emotional discipline. A strategy that looks perfect on paper can fail in practice if it’s psychologically unbearable. Traders who chase very high R/R ratios (like 1:5 or 1:10) may technically need only a 20% win rate to be profitable — but emotionally, enduring eight or nine consecutive losses before a win can break their confidence. On the other hand, traders who rely on very high win rates (like 80–90%) often face devastating losses when a single trade wipes out many small gains.
The equilibrium line, in this sense, represents not only mathematical balance but also emotional equilibrium. When your strategy operates near it, you experience a smoother equity curve and fewer psychological shocks. You’re neither overconfident from constant small wins nor crushed by long losing streaks.
This psychological stability is what separates professional consistency from amateur volatility. Sustainable traders design systems that sit comfortably near that line — not too aggressive, not too cautious.
4. Why Being Near the Line Is Optimal
Let’s analyze what “near the line” really means in practical terms.
If your trading system yields:
-
A Win Rate of 50–60%, and
-
A Reward/Risk Ratio between 1:1 and 2:1,
then you’re typically operating close to equilibrium. This zone represents what many professional traders consider the sweet spot.
Here’s why it works:
-
Mathematical stability – Small changes in your win rate or R/R don’t drastically change your profitability. You have a buffer against normal trading variance.
-
Psychological comfort – You’re winning often enough to maintain confidence and discipline.
-
Statistical realism – These values are achievable in most liquid markets without relying on improbable accuracy or huge price moves.
-
Risk control – Because your losses are capped and your wins are proportionate, your drawdowns remain manageable.
A system too far above the line (very high R/R with low win rate) might appear profitable but could be extremely volatile. Likewise, one far below (high win rate, tiny R/R) is like walking a tightrope — one bad loss can erase months of progress. The middle path, close to the line, ensures the trader remains adaptable and steady over time.
5. How to Stay Near the Line
Maintaining proximity to the equilibrium line isn’t accidental — it requires deliberate system design and continuous adaptation. Here are some guiding principles:
-
Define clear risk limits per trade. Never risk more than a small percentage (e.g., 1–2%) of your total capital.
-
Adjust reward targets based on volatility. Markets shift; adapt your take-profit distances to reflect realistic price movement.
-
Track your actual data. Log your trades, calculate your real win rate and R/R, and plot them on a matrix similar to the one in the image. See where you stand relative to the line.
-
Avoid overfitting. Don’t optimize your system for a perfect backtest that sits far above the line; real-world execution will bring you back closer to it.
-
Embrace balance over ego. Many traders sabotage themselves by chasing extreme performance metrics — “I want 80% wins” or “I’ll only trade setups with 5:1 R/R.” True professionals prefer consistency and balance.
6. The Dynamic Nature of the Line
Interestingly, the equilibrium line is not a fixed boundary in practice. While mathematically it defines break-even performance, in reality, traders’ transaction costs, slippage, commissions, and emotional errors shift the line slightly upward — meaning you must aim to be somewhat above it to remain profitable. This reinforces the principle that you should stay near, but ideally just above, the line.
Over time, as markets evolve and your skill improves, your personal equilibrium point may shift too. You might find that you’re more comfortable with a slightly higher R/R and lower win rate, or vice versa. The goal is to evolve while maintaining the same structural balance — a stable risk-reward dynamic that survives through changing market conditions.
7. Conclusion: The Wisdom of Balance
The chart in the image is more than a collection of numbers — it’s a map of trading truth. It teaches that success is not found in extremes but in equilibrium. Every trader must walk the fine line between optimism and discipline, ambition and realism. The equilibrium curve on the matrix embodies that truth: it’s where math, psychology, and risk management intersect.
Staying near that line means you respect both the probabilities and your own human limitations. You accept that losses are part of the game but ensure that your wins compensate for them. You aim for balance, not perfection.
In the long run, traders who operate close to this equilibrium line — not chasing ultra-high win rates or unrealistic R/R ratios — enjoy the most stable growth. Their performance curves are smoother, their confidence steadier, and their longevity in the markets far greater.
Ultimately, trading mastery is not about how far above the line you can get — it’s about how consistently you can stay near it.
Because in that zone of balance lies the true art of sustainable profitability.
